Football Transfer Analysis & Webscraping
I created this project when I was focussing my learning on data analysis. I used new tools and Python libraries for the first time, analysed the structure of websites to ensure that my web scraping produced usable data, and tested my abilities to work with a medium sized dataset. Statistics were an important part of my University degree and I enjoy working with data and figuring out correlations to support or disprove a theoretical argument. Coincidentally I am also a big football fan and have supported my team through highs and lows over the past 25 years. Having followed the German Bundesliga for such a substantial period of time, I noticed a comparative decline in international successes that seemed significant to me. Although most clubs' absolute turnover numbers are continuously increasing (interrupted of course by the Covid-19 pandemic), the Bundesliga seems to fall behind in comparison to the other European top leagues. This observation was supported by rather subpar international results of German clubs. I was intrigued to know if this decline was reflected in the transfers to and from Bundesliga clubs and if there was a trend that could be visualised by analysing them.
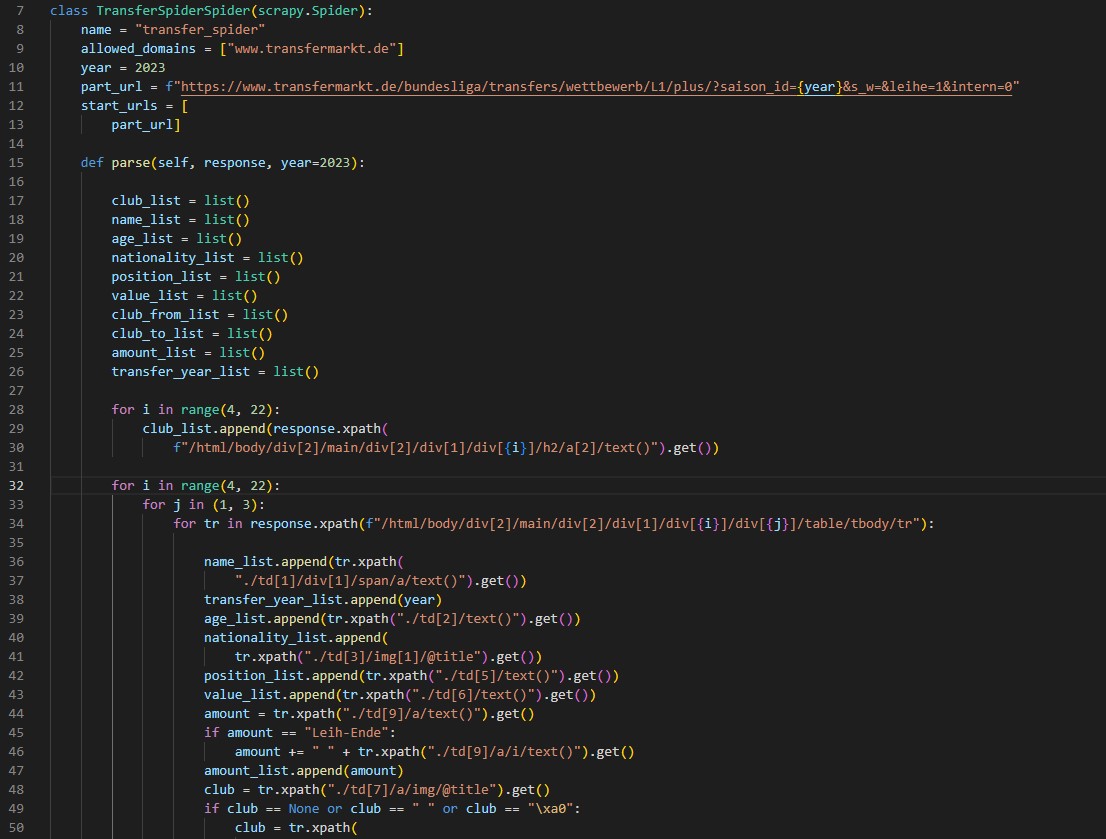
Acquiring the data - Web Scraping with Scrapy
Being a football fan, I am familiar with the most popular websites covering transfers. I used the web scraping framework Scrapy to collect the data from a website and stored it in a JSON file. This involved overcoming challenges like incoherent formatting, duplicate data entries for transfers between two Bundesliga clubs, and partially incomplete data. I was able to configure the web scraping algorithm to produce a fairly coherent dataset, reducing the need to clean up the data significantly.
Analysing the data - Jupyter, pandas, and Matplotlib
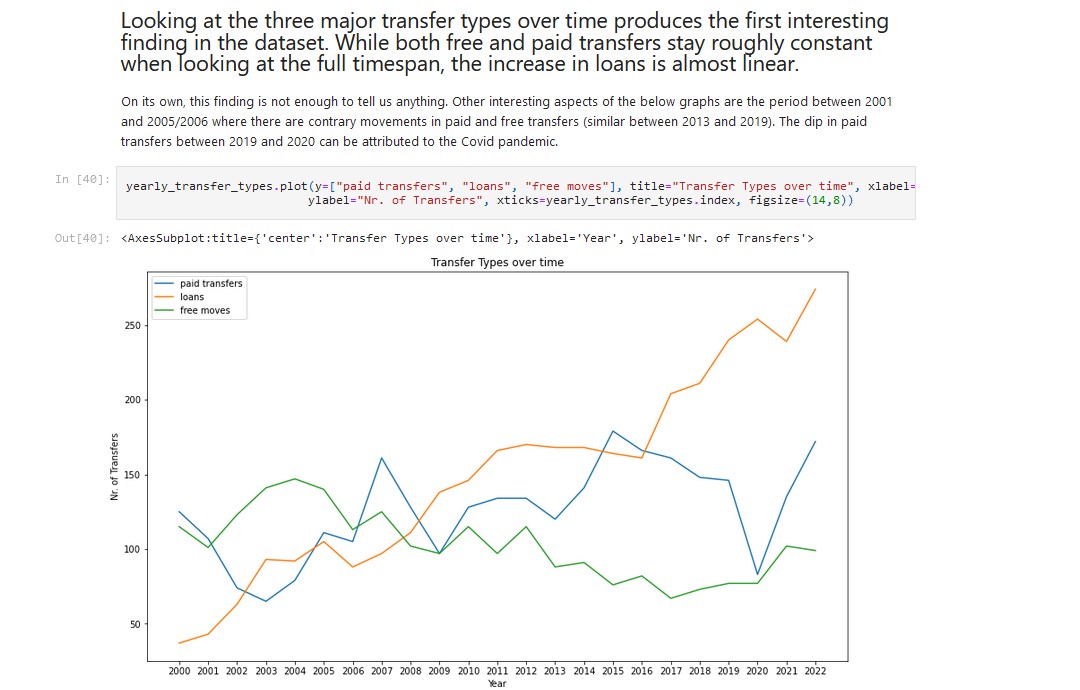
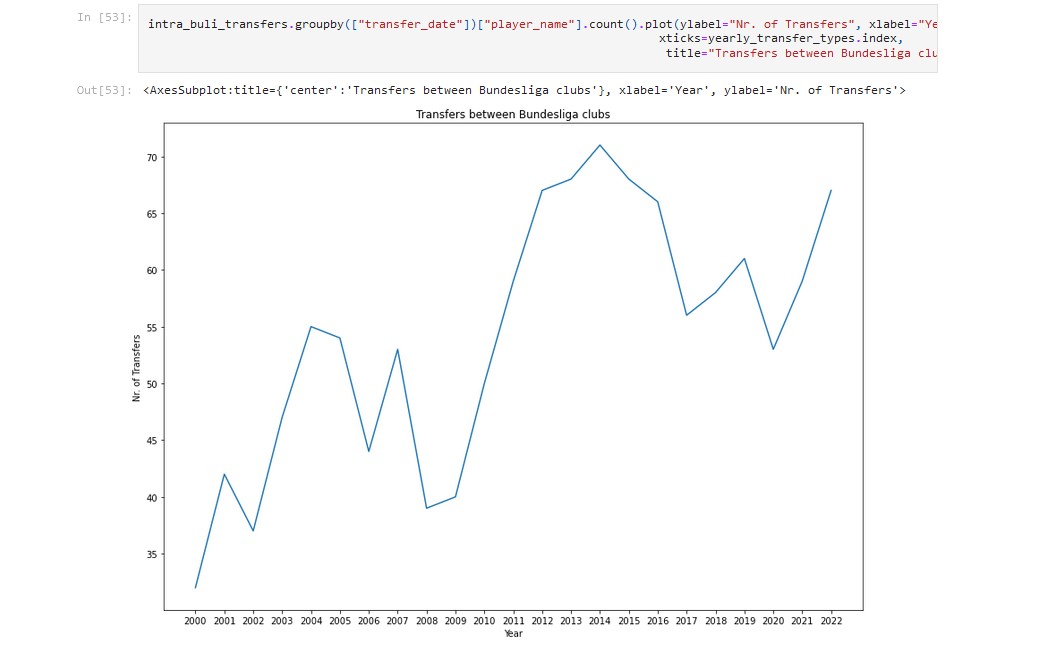
I formulated several hypotheses to be tested before I started to work with the data. These included for example: 'The average player age for transfers declined over time' or 'The number of transfers from the top leagues declined over time'. I did not stick to these hypotheses very strictly, as I intended to explore the data and learn how to properly work with the libraries and tools I was using, rather than producing academically correct results. I set up a Jupyter notebook and started to work with the data using the Python libraries pandas and Matplotlib for data manipulation and visualisation. I was able to figure out several trends in the data and visualise them, while at the same time expanding my knowledge on the tools and libraries I worked with.